Owen Sound 's Housing Problem
property taxes make a bad situation worse
The Problem
There is no question we are facing a crisis in housing and homelessness throughout Ontario. Housing affordability is a reality facing many families. Some are forced to rent inadequate accommodations that just don 't meet their family needs while those dreaming of home ownership are just priced out of the market. Canadian Urban Institute 's report released in 2019 cited the housing supply as the main cause of the housing crisis. This was echoed by Ontario 's Affordability Task Force Report in 2022. However, in many areas, Owen Sound for example, housing supply is not the only driving force.
|
The housing and homelessness crisis in Ontario continues to be a serious and widespread issue. Finding a place to live in Ontario is a struggle for many due to low vacancy rates, limited supply, and an insufficient mix of housing options. The costs of ownership and rental rates are rising much faster than incomes, and people experiencing homelessness are in desperate need of a roof over their heads. Association of Municipalities Ontario |
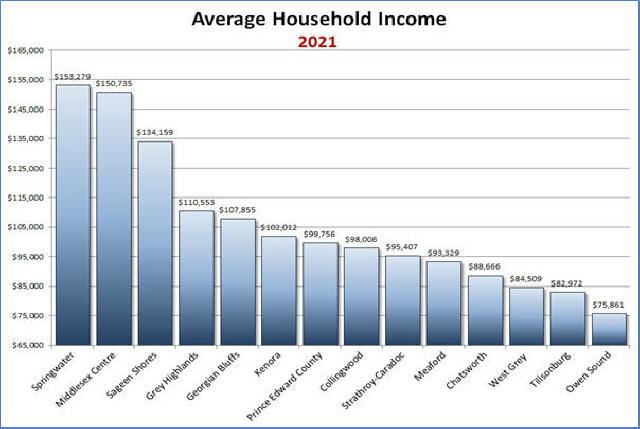
Wages in general are just not keeping up with the cost of housing in most communities. However, in communities like Owen Sound low household incomes coupled with rising costs make it particularly difficult for families. Owen Sound has one of the lowest average household incomes in the province at $75,861, which makes even small cost increases nearly unbearable for many families.
|
|
| Figure 1; Average Household Income source: BMA Municipal Studies |
It 's important to realize the significance of Owen Sound 's low household incomes. Most households have at least two wage earners which means that the average wage earner is taking home a gross income of about $38,000 which works out to be about $19 per hour. This is the average; which means that there are many families with household incomes of less than $75,861. In fact, when we look at the median (the middle), after-tax household income in Owen Sound we see that over half of the households in Owen Sound take home less than $57,600.
Affordable Housing
In Canada, housing is considered “affordable” if it costs less than 30% of a household 's before-tax income. If we take 30% of the household incomes from the 2022 BMA Report and divide 12 to get the gross monthly income for similarly sized urban municipalities, we get the results shown below in Figure 2.
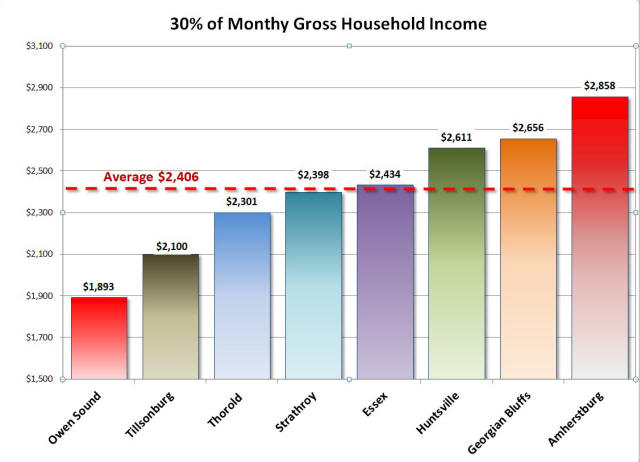 |
| Figure 2; 30% of Gross Monthly Household Income source 2022 BMA Report |
This informs us that in Owen Sound the average family can afford to spend $1,892 per month on rent or on combined mortgage and property tax. The problem for renters is that a two-bedroom apartment in Owen Sound cost $1,735 and $2,035. This means that families with the average household income will have difficulty in finding affordable housing in Owen Sound.
For families in this situation even small increases in the cost of essentials such as food or rent become very significant. Landlords routinely pass on increases in property taxes to tenants in the form of rent increases, such as those that have been imposed annually over the last 30 years. Therefore an increase in property taxes can result in families, both homeowners and renters, paying more than 30% of their gross household incomes on housing.
Impact of Property Taxes
In order to do a fair comparison among municipalities when it comes
to taxes you really need to measure the ability for the ratepayer to
come up with the money to pay their taxes. In other words the real
impact that taxes have on the resident. Statistics
Canada tells us that the median household after-tax income for Owen
Sound is $57,600. The 2025 BMA Report gives us the property taxes on the average detached bungalow
for the municipalities in our area. When we calculate the
ratio of monthly property taxes to the monthly after tax income
using the average household income we get graph should below showing
what percent of after tax income that people have to pay in property
taxes.
The graph above shows the taxes on a single bungalow as a percentage
of median, after-tax household income. According to Statistics
Canada, Owen Sound has the lowest household after-tax income in
Bruce-Grey. The Owen Sound taxpayer spends 7.7% of their after-tax
income on taxes; while the average taxpayer in our area spends only
4.4% of their income. This speaks volumes about the financial
well-being of Owen Sound families - all families, since landlords
pass on taxes in the form of rent increases. In other words Owen
Sound taxpayers are unfairly burdened by taxes as compared to
taxpayers in our adjacent municipalities. Note: that Georgian Bluffs
residents spend only 2.4% of their after-tax household income to pay
their taxes. This likely explains why so many employees choose to
live in Georgian Blufs and Meaford and commute to their jobs in Owen
Sound - including city employees.
The result is very enlightening.
This disparity did not come about recently. It developed over the
past 30 years so as a result of two alarming trends;
1) the loss of high paying jobs, and
2) unnecessary expense increases at city hall.
Those of us who were around in the 60s and 70s remember that Owen
Sound once had a thriving industrial base. We can see some of the
remnants of these industries today in the abandoned properties, like
the empty lots where the Black Clawson Kennedy foundry once stood on
the west and Russel-Hipwell 's on the east side. There was also the
Keenan 's Toothpick factory, RCA, Goodyear and Pittsburg glass to
name just a few.
During the time when these jobs were disappearing Owen Sound 's
population was at times stagnant and often shrinking. One would
think that a shrinking population would result in city expenses at
least remaining the same. Yet when we examine city expenses during
this period and beyond we see that expenses were growing at times at
twice the rate of inflation. This link shows expense growth during a
ten year period. Expense Growth. Much of this expense growth was
caused by the city 's propensity to hire more staff in spite of a
stagnate population.
There is no question we are facing a crisis in housing and
homelessness throughout Ontario. Housing affordability is a reality
facing many families. Some are forced to rent inadequate
accommodations that just don 't meet their family needs while those
dreaming of home ownership are just priced out of the market.
Canadian Urban Institute 's report released in 2019 cited the housing
supply as the main cause of the housing crisis. This was echoed by
Ontario 's Affordability Task Force Report in 2022. However, in many
areas, Owen Sound for example, housing supply is not the only
driving force.
The average salary expense for these municipalities, excluding
protective services salaries, was about $9 million in 2021.
Huntsville, Amherstburg and Owen Sound all had a Salary Expense
greater than the average. Owen Sound spent $13 million on Salaries &
Benefits, excluding Protective Services salaries. To reduce Owen
Sound 's expense to the average of $9 million, an expense reduction
of $4 million would be required.
The only question that remains is; how did we get to our current
situation where our municipal workforce is grossly over staffed in
comparison to other similarly sized municipalities? My initial
belief was that this disparity was created by Councils over the past
20 years or so by approving excessively high annual increases in
expenses. However when I examined the changes in Salaries and
Benefits expenses over a ten year period for Owen Sound and two
other municipalities, I found that I was mistaken. Owen Sound 's
problem has existed for a much longer time period.
Owen Sound 's Salaries & Benefits expense in 2011 was more than twice
that of either Strathroy or Springwater as shown in the chart below.
By 2021 this difference had reduced somewhat. What this tells us is
that, although the Councils over the last ten years added to the
problem, they did not create the problem. This disparity likely
originated as much as 40 to 50 years ago and each Council over this
period added a little to the problem until we got to where we are
today. I suspect that each of these Councils failed to ask the
critical questions at budget time; such as, if our population is not
growing why do you need hire more staff to run the city?
As you can see from
the above, Owen Sound actually had 87 residents fewer residents in
2021 than it had in 2011. Yet, Owen Sound 's Salaries & Benefits
expense grew by $1.6 million. This suggests that there were at least
some additions to the workforce during this period. However, it 's
quite clear, a preponderance of the problem originated prior to
2011.
Prior to the 2023
budget I requested Council to address this problem in the 2023
budget.
As well I showed them that we needed a two-percent
tax reduction in order to close the tax-game with Georgian Bluffs.
My
2023 Service Review Paper. Unfortunately not one member of Council voted
to address this problem in the 2023 budget nor in any budget since
then.
If council were to
be persuaded to “right size” the city workforce so that the city 's
salaries and benefits expense matched the average of the eight
municipalities in the study group we would have $4 million in
surplus tax revenue each and every year. With this we could begin to
address the many Social problems we have in our community as well as
significantly reduce taxes for all residents. For example in the
past I advocated for the city to spend money on temporary winter
housing for the homeless. Some of this surplus could be used to
ensure warm winter housing for those in need each and every winter.
I now challenge all candidates for Council in 2026 to commit to
taking up this challenge. What Do You Think?
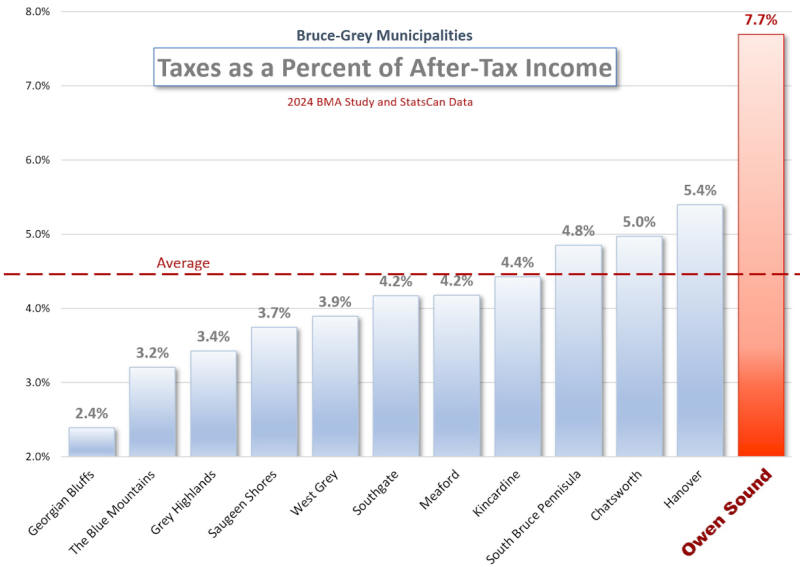
Figure 3;
Property Taxes as a
Percentage of After Tax
Household Income
source:
2022 BMA Report
The Solution -
to Ease the Pressure on Families
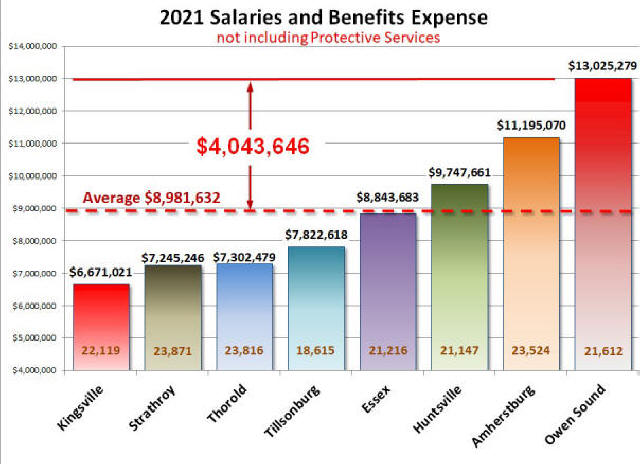
Figure 4;
Comparing Salary-Benefit Expense for
Similarily Sized
Municipalities Delivering Similar Services
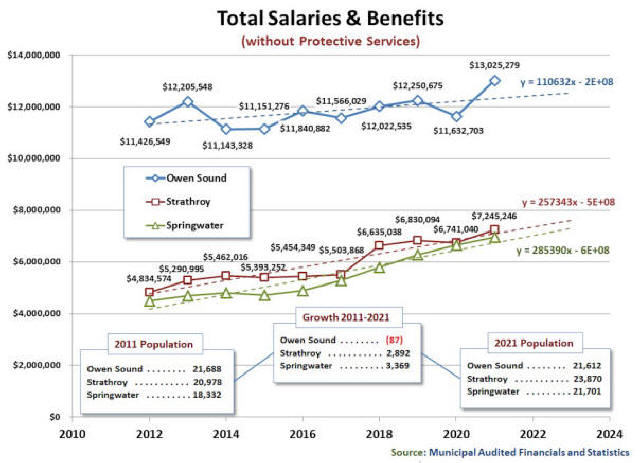
Figure 5;
Historical Changes in Salaries & Benefits Expense for
Three Similarly Sized Municipalities